Agriculture in the UK 2023
| Trade in food, feed and drink in real terms at 2023 prices | 2021 | 2022 | 2023 |
|---|---|---|---|
| Imports of food, feed and drink | 63,537 | 66,966 | 61,081 |
| % of total UK imports | 11% | 10% | 10% |
| Exports of food, feed and drink | 24,483 | 27,499 | 24,425 |
| % of total UK exports | 6.1% | 6.3% | 5.8% |
| UK food production to supply ratio (‘self-sufficiency’) | 2021 | 2022 | 2023 |
|---|---|---|---|
| % of all food | 61% | 60% | 62% |
| % of indigenous type food | 74% | 73% | 75% |
In 2023, the agri-food sector employed just under 4.4 million people, or 14% of all employees in Great Britain. This proportion has been broadly the same since 2001. Agriculture accounts for less than half a million employees or 10% of the agri-food sector.
In 2023 the value of food, feed and drink imports decreased by 8.8% to £61.1bn in real terms, resulting in the trade gap in food, feed and drink of £36.7bn in real terms, a decrease of 7.1% since 2022.
Self sufficiency in food
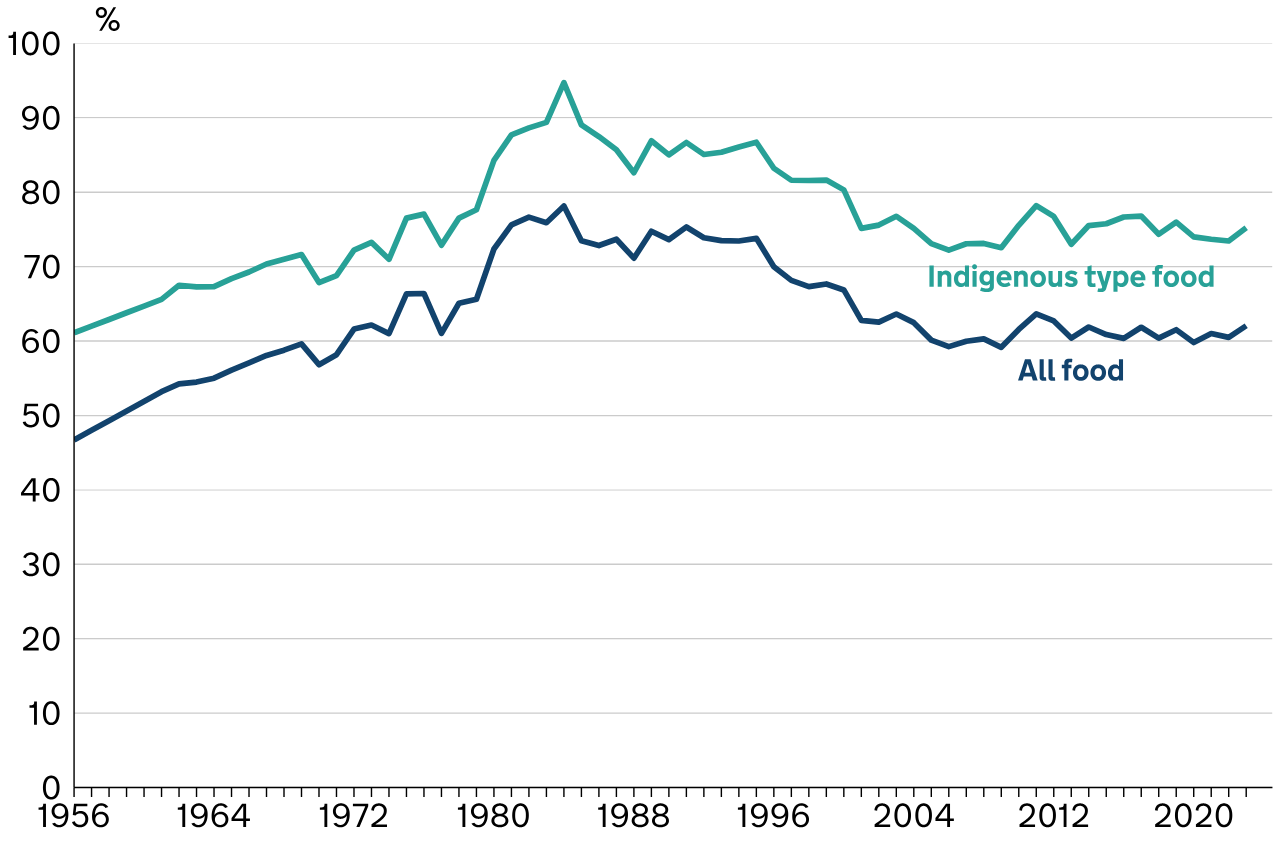
The food production to supply ratio (commonly referred to as the “self-sufficiency ratio”), is calculated as the farmgate value of raw food production divided by the value of raw food for human consumption and is estimated to be 62% for all food in 2023 and 75% of indigenous type food. The food production to supply ratio provides a very broad indicator of the ability of United Kingdom agriculture to meet consumer demand - also described as competitiveness. The ratio is not an appropriate measure of “food security”. In 2023, 58% of domestic consumption came from UK production (based on unprocessed value at farmgate), 24% from the EU and the remaining 18% from the rest of the world.
| Category | 2021 | 2022 | 2023 |
|---|---|---|---|
| Cereals | 86% | 92% | 93% |
| Wheat | 89% | 95% | 96% |
| Barley | 110% | 112% | 113% |
| Oats | 101% | 121% | 120% |
| Other crops | |||
| Oilseed rape | 52% | 64% | 63% |
| Sugar beet | 63% | 55% | 54% |
| Fresh vegetables | 57% | 54% | 53% |
| Potatoes | 74% | 63% | 62% |
| Cabbages | 90% | 85% | 81% |
| Cauliflowers and broccoli | 64% | 54% | 49% |
| Carrots, turnips and swede | 95% | 98% | 96% |
| Mushrooms | 47% | 49% | 48% |
| Lettuce | 34% | 43% | 44% |
| Tomatoes | 17% | 15% | 15% |
| Fresh fruit | 15% | 17% | 16% |
| Apples | 37% | 41% | 38% |
| Pears | 16% | 14% | 13% |
| Plums | 9% | 14% | 13% |
| Strawberries | 64% | 67% | 66% |
| Raspberries | 30% | 38% | 38% |
| Meat and dairy | |||
| Beef and veal | 83% | 87% | 85% |
| Pig meat | 71% | 69% | 64% |
| Mutton and lamb | 108% | 107% | 114% |
| Poultry meat | 93% | 84% | 82% |
| Milk | 105% | 105% | 105% |
| Eggs | 92% | 90% | 87% |